The findings of the recent comprehensive technical study (2020–2022) of all four works by or attributed to Vermeer at the National Gallery of Art, Washington, are presented in three articles in this issue. This section offers guidance on using the JHNA image viewers and expands on the brief technical overviews in the articles with additional detail on the analytical methods used. For those who have not previously used such documents, we offer suggestions on how to interpret technical evidence. For those who regularly use such evidence in their research, the specific operating parameters of each method can be found in the endnotes of each section below. Whereas prior studies mainly relied on microanalysis of paint samples and magnified examination of the painted surface with a stereomicroscope, this study also used extensive analysis based on non-invasive chemical imaging spectroscopy, the results of which are presented in the form of images and maps, rather than graphs, making them accessible to a wider audience. Each of these methods are discussed below.
The JHNA Image Viewers
The Multi-Mode Viewer

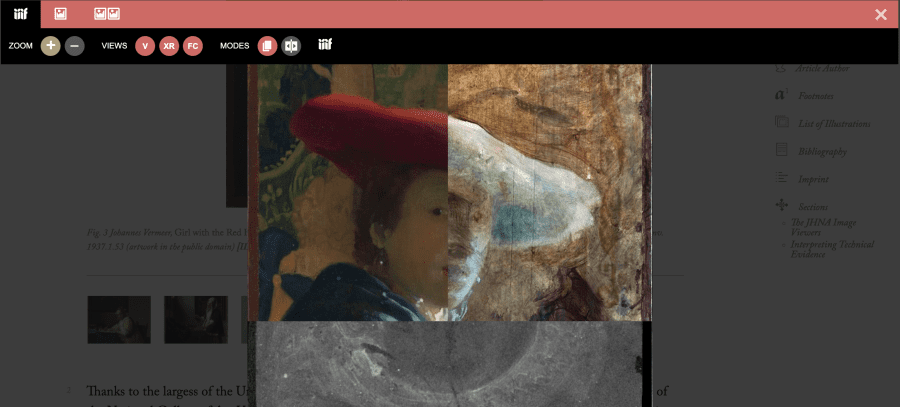
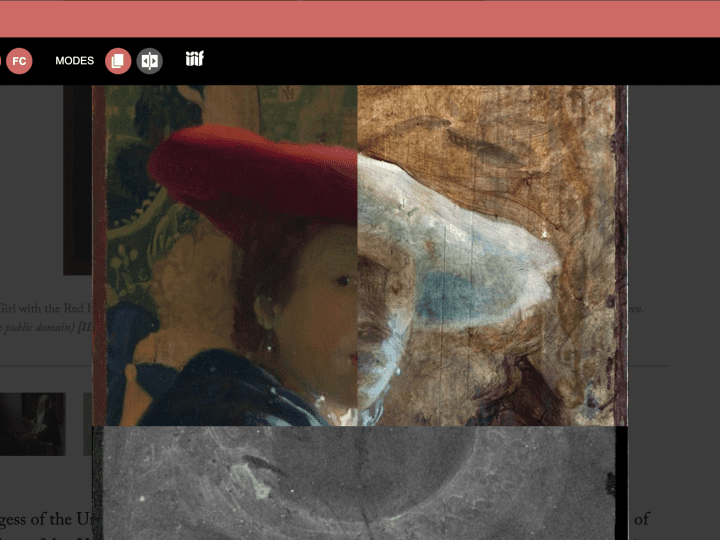
In the multi-mode viewer, using IIIF (International Image Interoperability Framework) images, the surface of the painting can be compared to the technical images, and each can be studied at increasing magnification (at times, up to a microscopic level) in “layer mode” or “side-by-side mode” (fig. a). Using this viewer, it is also possible to correlate the partially overlapped layering of brushstrokes visible on the painting’s surface to the layers of the painting (also seen in paint cross sections).
Thanks to the generosity of the University of Heidelberg’s heidICON in hosting IIIF images, all IIIF images of the National Gallery of Art Vermeer paintings can be seen in the following IIIF Manifests, and be re-used in separate image comparison in other IIIF-compatible viewers.
- Fig. 1 Johannes Vermeer, Girl with the Red Hat, ca. 1669, oil on panel, 22.8 x 18 cm. National Gallery of Art, Washington, DC, Andrew W. Mellon Collection, inv. 1937.1.53 (artwork in the public domain): https://heidicon.ub.uni-heidelberg.de/manifest/iiif/1698153/manifest.json
- Fig. 2 Johannes Vermeer, Woman Holding a Balance, ca. 1664, oil on canvas, 39.7 x 35.5 cm. National Gallery of Art, Washington, DC, Widener Collection, inv. 1942.9.97 (artwork in the public domain): https://heidicon.ub.uni-heidelberg.de/manifest/iiif/1698157/manifest.json
- Fig. 3 Johannes Vermeer, A Lady Writing, ca. 1665, oil on canvas, 45 x 39.9 cm. National Gallery of Art, Washington, DC, Gift of Harry Waldron Havemeyer and Horace Havemeyer Jr., in memory of their father, Horace Havemeyer, inv. 1962.10.1 (artwork in the public domain): https://heidicon.ub.uni-heidelberg.de/manifest/iiif/1698155/manifest.json
- Fig. 4 Studio of Johannes Vermeer, Girl with a Flute, probably 1669/1675, oil on panel, 20 x 17.8 cm. National Gallery of Art, Washington, DC, Widener Collection, inv. 1942.9.98 (artwork in the public domain): https://heidicon.ub.uni-heidelberg.de/manifest/iiif/1698151/manifest.json
The Side-by-Side Viewer

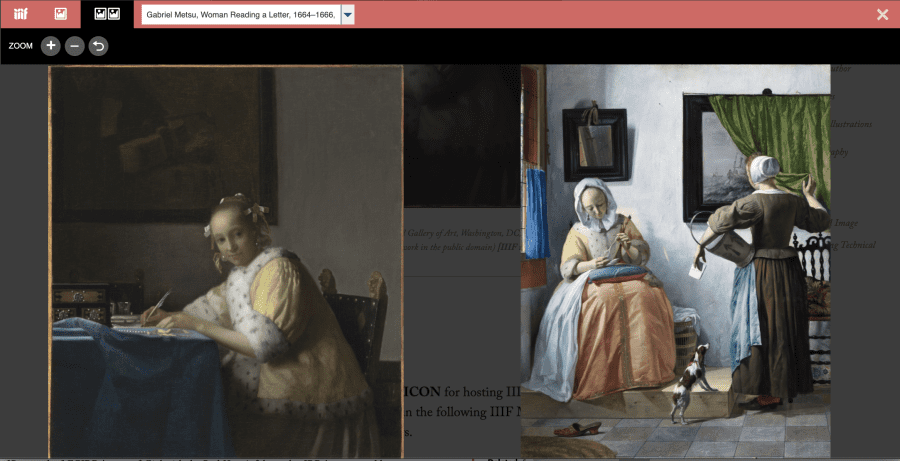
Using the side-by-side viewer, the reader can juxtapose any two works of art illustrated in each article, zooming in to make detailed comparisons (fig. b). Click on any of the images in the slide show below (figs. 5–27) to access this viewer. Use the icons in the toolbar to toggle between the single image viewer and the side-by-side viewer. Use the drop-down menu to compare that image to any other work of art illustrated in this article.
Interpreting Technical Evidence
Magnified Examination of the Paint Surface

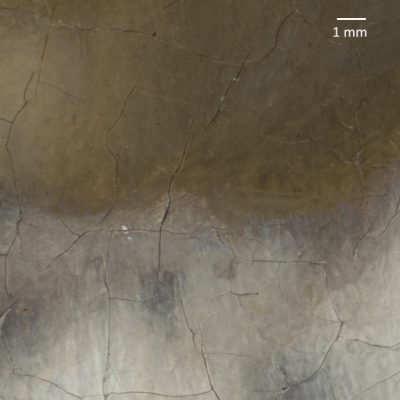
The information collected through varied analytical methods is interpreted in the context of the paintings themselves, studied at high magnification using a stereomicroscope (fig. c). The JHNA image viewers invite readers to join in this interpretation. Because it is essential to compare paint handling at the same scale, this evidence is presented throughout the articles in close details and even closer photomicrographs with scale bars that indicate the magnification.
By studying the surface of the painting at high magnification, we can see Vermeer at work. Close examination reveals individual brushstrokes and allows us to characterize the handling of paint. We often can deduce the order in which Vermeer painted individual details by looking to see whether brushstrokes lie over earlier paint that had already dried, or whether they blend wet-into-wet with the underlying brushstrokes. Examination through minute gaps in the final brushstrokes gives information on the early stages of the painting process—the ground, painted sketch, and underpaint—that can contribute to the interpretation of the technical images.
Reflectance Imaging Spectroscopy
Reflectance imaging spectroscopy (RIS) measures the amount of visible and infrared light that is reflected by artists’ materials within paint layers. Typical technical images produced from RIS analysis include material maps or false-color reflectance images.1 The articles in this issue show only high spatial resolution false-color reflectance images acquired with a different instrument in the infrared spectral region, here called false-color IRR.2
In this technique, three infrared images are assigned different colors and combined to create a false-color IRR, separating pigments more clearly than is possible with traditional infrared reflectography, which shows one infrared image in grayscale (figs. 28–31).
X-ray Fluorescence Imaging Spectroscopy
X-ray fluorescence imaging spectroscopy (XRF element mapping) measures the energy distribution of emitted X-ray radiation after excitation of the artist’s materials.3 The output technical images are maps of chemical elements, such as iron found in yellow and red ochres and lead found in lead white or lead tin yellow (figs. 32–44).
Point Analysis
In addition to mapping information across the paintings, detailed information at discrete points on the paintings was gathered through microscopic analysis of minute paint samples and through chemical spectroscopic methods that do not require samples.
Paint Cross Sections
When analyzing paint cross-sections (samples that include all layers of the paint stratigraphy), light microscopy reveals the sequence of paint and ground layers corresponding to the different stages of Vermeer’s painting process.4The visual characteristics observed in the cross section give information on the pigments present, and scanning electron microscopy with energy dispersive spectroscopy analysis (SEM-EDS) helps to identify further the specific pigments used by showing the distribution of the chemical elements (e.g., calcium, iron, lead, etc.) in the paint layers (figs. 45–47).5
These microscopic samples are removed, using eye-surgery scalpels, only from areas of existing damage; they are then mounted to show the paint layers in cross section and examined with a light microscope at up to 500x. In each sample image, the length of the scale bar (units of the numerical length) is given in micrometers (µ): one micrometer equals one thousandth of a millimeter.
Polarized Light Microscopy
Polarized light microscopy (PLM) gives detailed information on individual paint layers by identifying single pigment particles and characterizing pigment mixtures.6 Dispersed pigment samples consist of a few grains of paint collected from the paint surface without leaving a visually perceptible loss. Identifications are made by observing particles’ interactions with light in various orientations.
Point chemical spectroscopic methods
Reflectance imaging spectroscopy (RIS) can be implemented as a point measurement (gathering information from a single point on the painting). A method commonly referred to as fiber-optic reflectance spectroscopy (FORS) uses a fiber-optic probe to collect the reflected light. When X-ray fluorescence imaging spectroscopy is implemented as a point measurement, the technique is commonly referred to as X-ray fluorescence (XRF) analysis.


