This paper discusses the collaborative development of the Down to the Ground (DttG) database of colored grounds in sixteenth- and seventeenth-century paintings, with a particular focus on how creating data frameworks to study paintings on a large scale can support art historical research. Comparative technical art historical study, using previously published data alongside new findings, can often be complicated due to the great variability of methodologies and terminology developed in different time periods. Creating protocols to handle complex information in a systematic way, while retaining its original intent, has been central to this research. The DttG database shows how technical art history stands to benefit from digital tools and how the approach taken here to incorporate data of variable quality and age can be a model for future comparative research projects.
Colored grounds are an essential part of the painting process, as highlighted by the other contributions in this special issue of JHNA, but their use in the sixteenth- and seventeenth-century Netherlands remains only partially understood. Hessel Miedema and Bert Meijer were the first to address the topic in 1979, basing their hypotheses on a group of nineteen sampled paintings. Since then, Ella Hendriks has investigated the grounds of Haarlem painters; Karin Groen has studied Rembrandt and his circle; Maartje Stols-Witlox has surveyed recipes for ground layers; and, most recently, Sabrina Meloni and Marya Albrecht have applied cutting-edge methods to analyze Jan Steen’s grounds.1 Despite these and similar efforts, however, no comprehensive survey has yet been made of how Dutch and Flemish artists more broadly used colored grounds during this period. In the absence of such a survey, the art historical narrative has continued to rest largely on the premise set by Miedema and Meijer.2
This lack of a larger comparative framework has also allowed certain assumptions to persist unchallenged. Two of the most influential are Miedema and Meijer’s idea that colored grounds were imported from Italy and the claim that gray-over-red grounds are typical of Amsterdam painters. The latter assumption probably derives from Karin Groen’s extensive research on Rembrandt and his circle, but over time it has become generalized to Amsterdam painters as a whole. Both of these notions continue to shape interpretation, even though the technical evidence supporting them is limited. Examining such received wisdom more critically is essential if we are to move beyond hypotheses based on isolated cases toward a fuller understanding of Netherlandish painting practice.
The Down to the Ground (DttG) database of colored grounds addresses this gap by offering a research tool that can support the broad study of the introduction and spread of colored grounds in Netherlandish painting between 1500 and 1650.3 The database was created in the context of the Dutch Research Council (NWO)-funded five-year Down to the Ground project, which began in 2019 with the aim of writing an interdisciplinary history of colored grounds in the Netherlands. Data on colored ground layers from sixteenth- and seventeenth-century northern and southern Netherlandish paintings were gathered from published and unpublished sources and supplemented with new technical research.4 In this article, we trace the evolution of the database from its initial form as a cumbersome Excel “master” spreadsheet, which, while adequate as a repository, lacked the flexibility and functionality needed for in-depth research. To overcome this and to unlock the potential of the data, we created a tool that enables researchers to interact with the data dynamically and formulate advanced queries based on the metadata. Furthermore, the methodology developed along with this database should support other projects aiming to combine existing and new technical research on a larger scale than has previously been possible. At the moment of this article’s publication, the database contains information on more than eight hundred Netherlandish paintings, with more examples being added.5 The data were collected by Moorea Hall-Aquitania starting in 2018 and consists of both published and new technical research.6 The database was designed by Hall-Aquitania and Paul J. C. van Laar, the coauthors of this article, and developed by Van Laar in 2022. It is hosted at the RKD – Netherlands Institute for Art History (hereafter RKD) for a minimum of five years, beginning in October 2025, and will be updated quarterly, with new additions submitted through the accompanying Down to the Ground RKD Study.7
The Database in Action: The Case of Abraham Bloemaert
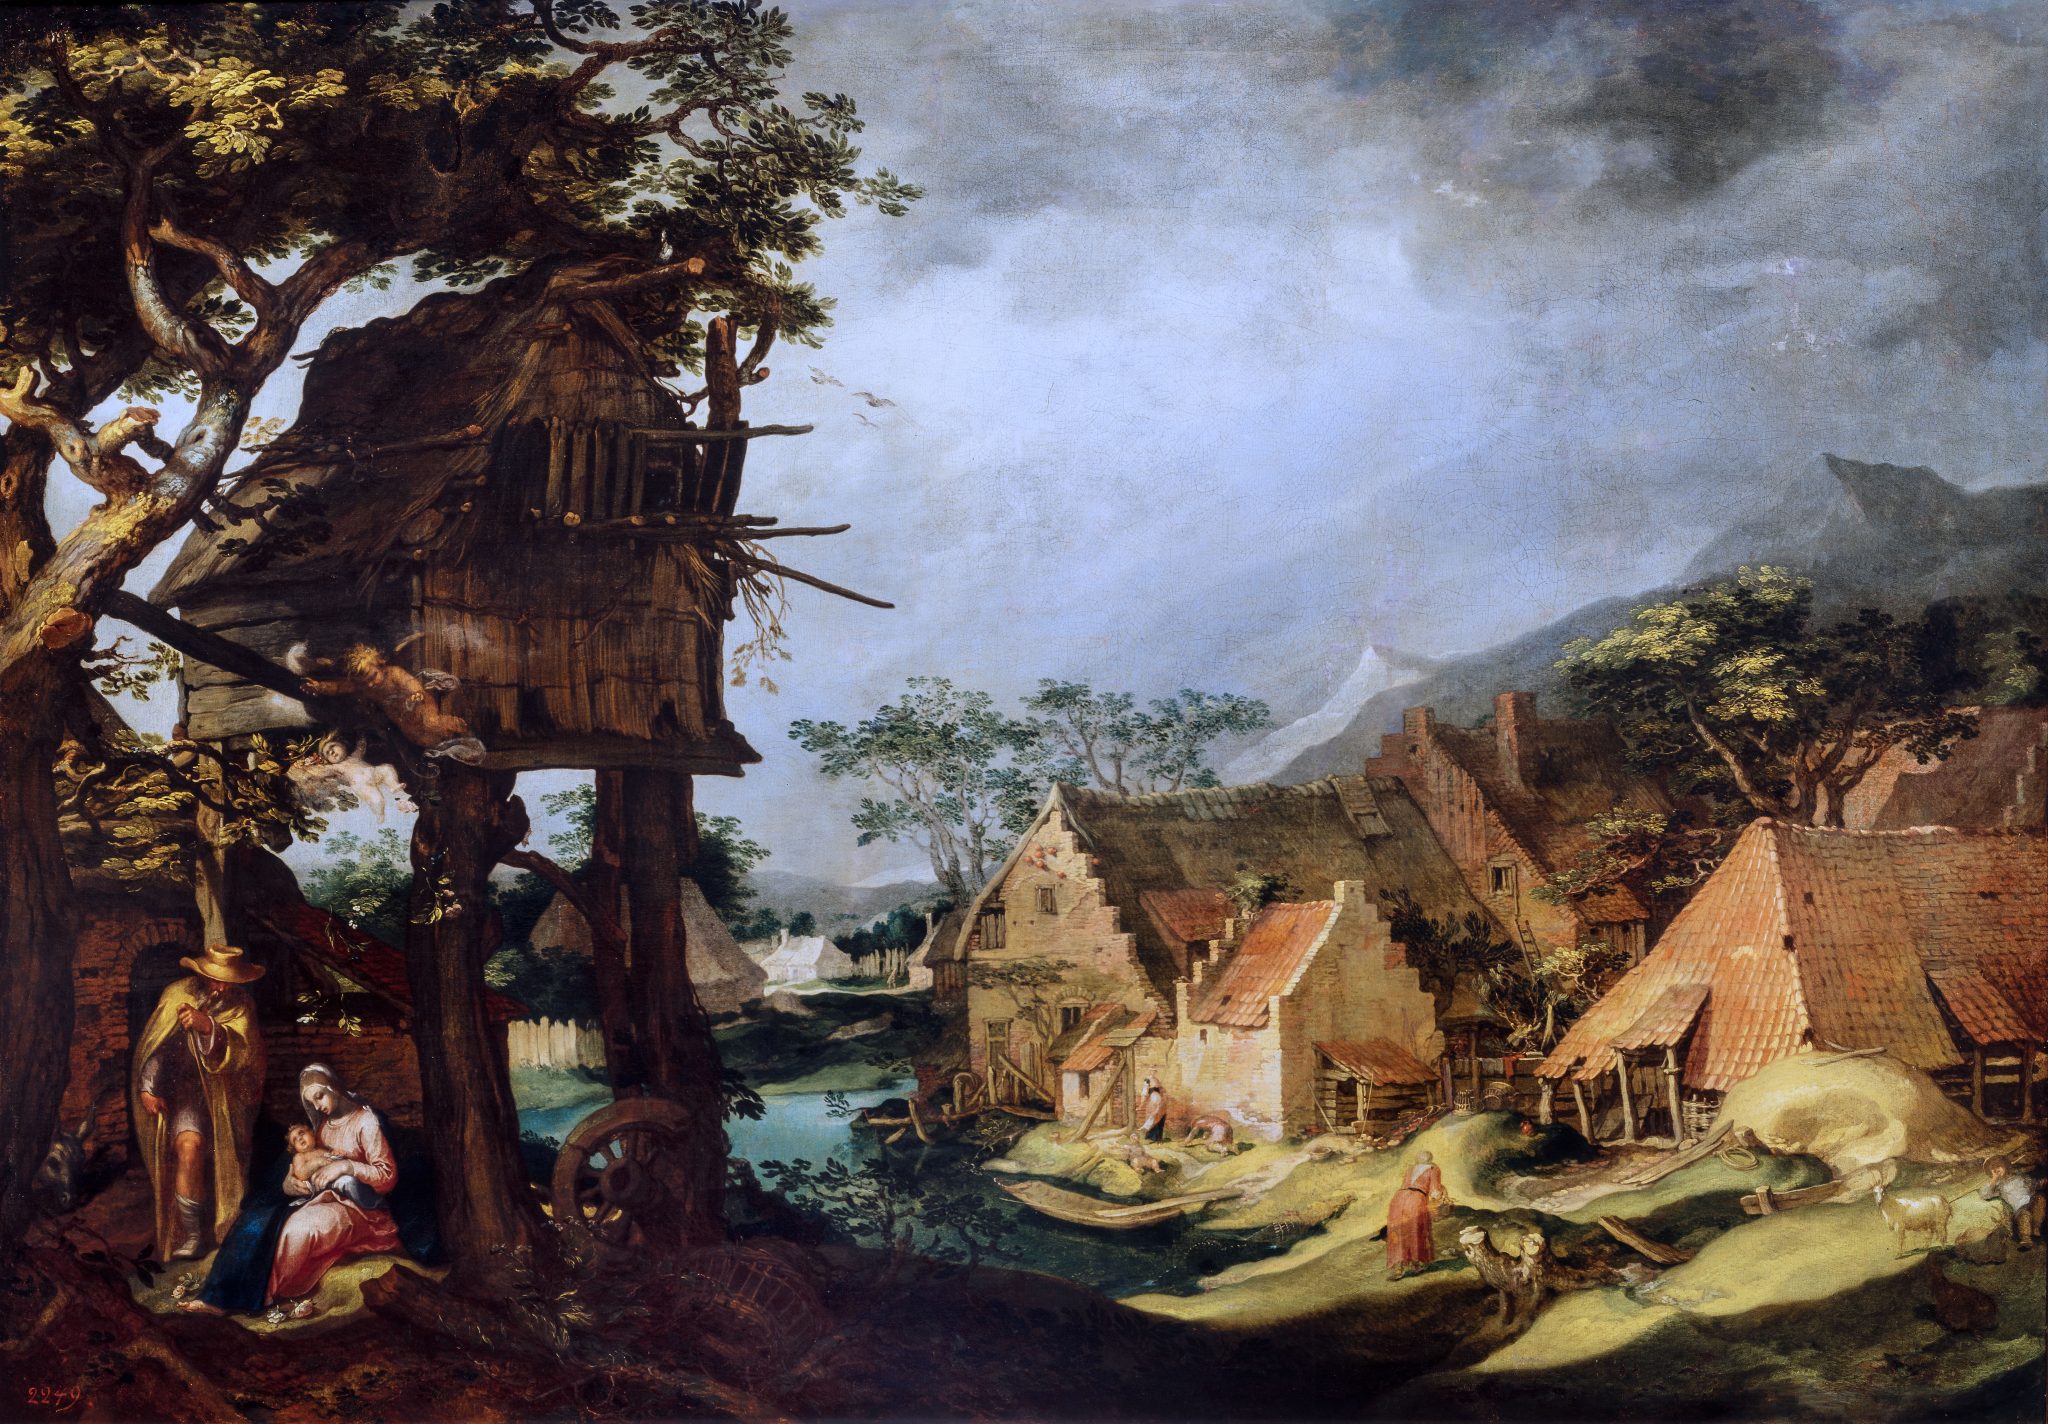
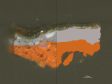
To demonstrate the potential for technical art historical contextualization with the DttG database, we begin with a close examination of Abraham Bloemaert’s (1566–1651) Landscape with Rest on the Flight to Egypt, painted between 1605 and 1610 (fig. 1). The painting is executed on a gray-over-red double ground, which is a common seventeenth-century ground construction consisting of two layers. The first is most often a thicker layer based on red earth pigments in oil, and the second is commonly lead white–based with black and/ or brown earth pigments added to produce a gray or brown tone (fig. 2).8 In Bloemaert’s painting, the gray upper ground is left exposed in many areas of the finished painting, helping to create atmospheric effects like the increasingly grayish haziness of color in the receding background and mountains. Bloemaert also used it to speed up the painting process in areas like the roofs of the houses and the trunks of some trees in the middle ground. While completely convincing from a normal viewing distance, close inspection reveals that these elements are rendered with minimal dabs of red paint and thin strokes of black, allowing the gray ground to do much of the work and creating convincing textures with remarkable efficiency (fig. 3). By contrast, the red lower ground appears to have had little or no visible impact on the final appearance of the painting, corroborating the conclusions of Maartje Stols-Witlox and Lieve d’Hont, who suggest that upper ground layers were those used by the artist for color, while the lower layers were chosen for structural or economic purposes.


Already, this single painting tells us much about what kind of ground an artist like Bloemaert was using in the early seventeenth century and how it played a role in his painting process. However, it also raises questions that can only be answered through a broader comparison: What can we learn about his training, exposure to other artistic traditions, or his place in the artistic environment of Utrecht? Does this technique align Bloemaert with his contemporaries, or does it set him apart? What can the kind of ground he painted on tell us about his role in the history of Dutch art?
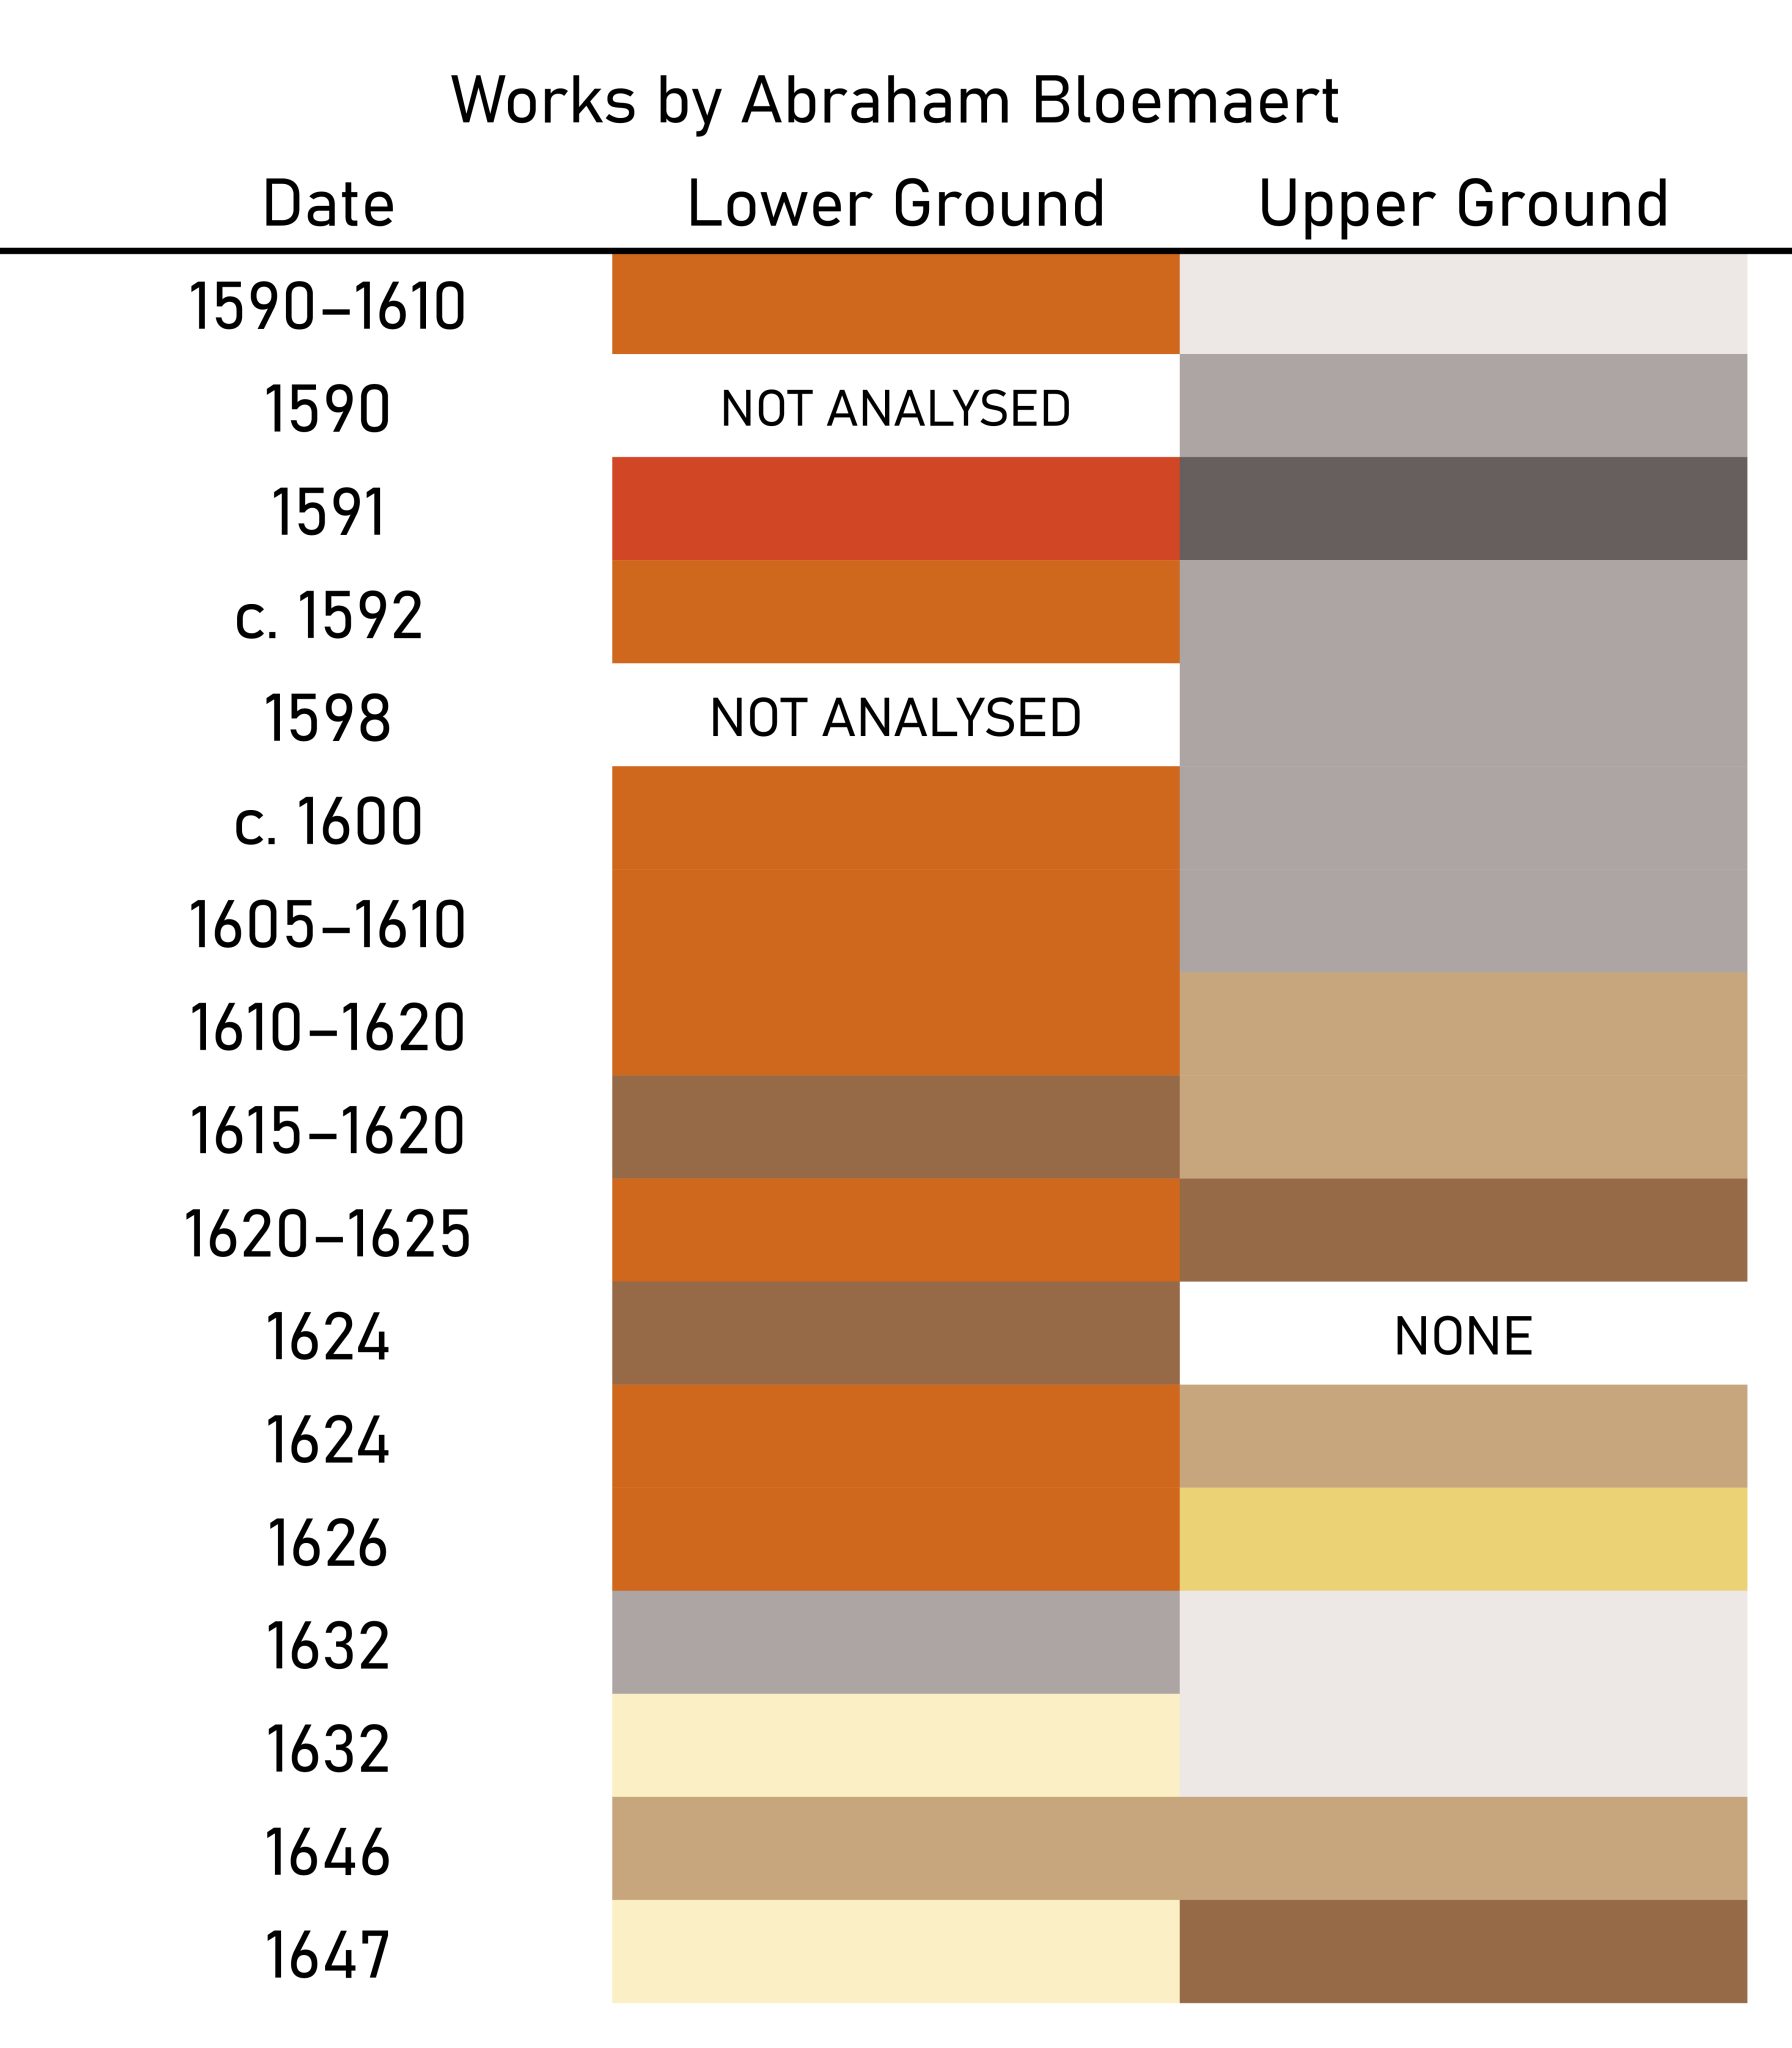
Landscape with Rest on the Flight to Egypt is just one of nineteen paintings by Bloemaert studied for the DttG project. 9 In this group, which constitutes a significant sample of his oeuvre from a technical art historical perspective, there are at least eight paintings with double gray or brown-over-red grounds, indicating that this was a commonly used preparation for Bloemaert. If we exclude his paintings on panel and those not sampled, nearly three-quarters of Bloemaert’s paintings on canvas have a double ground, and all of his sampled paintings executed before 1610 have a gray upper ground (fig. 4).
That this ground structure was typical for Bloemaert at the turn of the seventeenth century invites comparison with other grounds used in Utrecht at the time. Bloemaert appears to have first adopted this preparation in 1591.10 The only other painter known to have used a gray-over-red double ground in late sixteenth-century Utrecht was Bloemaert’s colleague Joachim Wtewael (1566–1638), who used this ground type in at least two paintings currently in the DttG database, both from the 1590s.11 Importantly, Bloemaert’s students readily adopted this practice. Of the sixty-five paintings by Bloemaert and his students included in the database, at least forty feature a similar double ground. This prevalence suggests that Bloemaert introduced the ground type to Utrecht, where it quickly gained popularity among his peers and students.12 Although little is known of Bloemaert’s training, he may have encountered the technique during his time in France, which—as Stéphanie Deprouw-Augustin’s contribution to this issue shows—was an early center of colored grounds. 13 Although the evidence is limited, painters in Utrecht before Bloemaert appear to have favored lighter or more neutral grounds. Bloemaert’s frequent use of darker, especially gray-on-red double grounds therefore represented a distinct shift in local practice. His early and consistent use of this new type of ground positions him among the technical innovators of his time.14 By introducing darker colored grounds in Utrecht and transmitting the practice to his many students, he played an important role in shaping the technical direction of Dutch painting at the turn of the seventeenth century.
The broader data contained in the DttG database suggests that Utrecht was the first city to adopt this ground type on a significant scale.15 The gray-over-red ground would later become extremely popular in Amsterdam, but based on current technical data, it did not appear there until around 1622.16 Rembrandt van Rijn (1606–1669), who famously used this type of ground throughout his early career, did not employ it until 1632.17 After 1630, it became one of the most popular grounds in Netherlandish painting, underscoring Utrecht’s early and pivotal role in its development.18
The DttG database thus provides an important resource for moving beyond isolated observations of individual paintings, enabling us to contextualize works within an artist’s broader oeuvre, among their peers and pupils, and within the wider artistic landscape of their time. While the database does not yet represent the entirety of Netherlandish painting from 1500 to 1650, it is the largest and most comprehensive group assembled to date. Despite the limitations of the currently available data, we can now draw provisional conclusions about the earliest use of certain ground types and track their spread across the Netherlands, based on a clear set of accessible data.
Data Curation
Data Collection
The creation of the DttG database was driven by the need for a comprehensive overview of grounds used by Netherlandish artists from the sixteenth century onward. Although such data does exist to some extent, it is often confined to narrowly focused case studies or unpublished internal museum documentation and conservation reports. To address broader art historical questions, it was essential to move beyond such isolated datasets. Therefore, the database not only contains new data from the DttG project, but it also incorporates preexisting data from its partner institutions and from published sources.19 It should be noted that, despite the broad access the project provides to data about these paintings, certain biases remain.20 Currently, the database is inclined toward works by artists who have historically been privileged in exhibitions and research projects. While the goal is to include a representative range of paintings from all sectors, the Southern Netherlands and the sixteenth century remain underrepresented. The aim is to remedy this with targeted research as the database grows.
The data on colored grounds are taken from sources of varying comprehensiveness. In some cases, the available information is limited to written descriptions based on observation of the painting’s surface alone, or from microscopic analysis performed as long as fifty years ago. In contrast, samples from other paintings have been analyzed more recently using color-corrected microscopy, scanning electron microscopy with energy dispersive X-ray spectrometry (SEM-EDX), and other state-of-the-art equipment.21 But relying solely on new technical research would have drastically reduced the scope of the initial dataset launch, due to the time, access, and resources required to perform such analysis. The inclusion of data obtained through earlier methods or limited examinations serves two critical purposes: first, it ensures that the valuable research conducted prior to current rigorous analytical protocols is not overlooked; and second, it allows for a far more comprehensive dataset than ever before.
This approach is grounded in the understanding that the information gathered through more modest means, such as surface-level visual inspection or standard conservation documentation, can still contribute meaningfully to broader comparative studies. Rather than drawing a hard line between high- and low-quality data, our approach seeks to integrate them within a transparent and systematic framework. This inclusive model encourages a broader view of material and artistic practice, recognizing that even cursory examinations may help reveal patterns otherwise obscured in a smaller, more selective dataset.
The use of data from diverse origins introduces significant complications that must be accounted for in the database structure, both to preserve their specificity and to ensure that contributing researchers and institutions are properly credited. For this reason, we decided to exclude cross-section images and SEM-EDX data in order to avoid copyright issues, although provisions have been made to incorporate such material in the future should restrictions be lifted. This approach favors breadth of coverage over depth, while preserving flexibility for future expansion. At the same time, it must be acknowledged that much of the material reflects incomplete information, outdated analytical protocols, and the inevitable subjectivity of researchers.
As the database expanded from a simple spreadsheet to a more complex structure—capturing not only titles, artists, and accession numbers but also ground-specific information and metadata on sources and methods—it became evident that further progress required reckoning with the complexity and unevenness of the material gathered. This unevenness revealed itself in two ways: first, in the varying levels of analytical scrutiny, which ranged from simple microscopic observations of a surface to finely resolved elemental analyses of individual particles; and second, in the personal judgments of researchers, especially in the language used to describe color (for example, “reddish brown” versus “brownish red”). These challenges prompted the development of two systems designed to make such diversity legible: one to gauge the reliability of the data and another to bring greater consistency to the description of color.
Reliability Rating
A “reliability rating system” was developed as an additional field to allow for filtering data based on research quality. Within this system, each painting is assigned a numerical rating from 1 to 4, with 1 indicating the highest reliability and 4 the lowest:
- Elemental analysis (such as SEM-EDX) confirming microscopic cross-section analysis.
- Microscopic cross-section analysis without elemental confirmation.
- Surface analysis by a skilled individual, ideally a paintings conservator with magnification.
- Written descriptions form the basis, but the research methods are unclear.22
The primary benefit of this system is that it allows the data to be sorted easily by quality. Conclusions emerging from the total dataset can be cross-checked against subsets of only the highest-quality data, to ensure that potential errors in lower-level data do not skew observations. Similarly, outliers with lower reliability can more easily be omitted when formulating hypotheses. A system like this greatly improves the usability of a dataset that varies in its underlying analytical rigor, and it can easily be adapted to other projects with different measurement criteria.
Color System
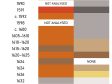
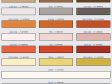
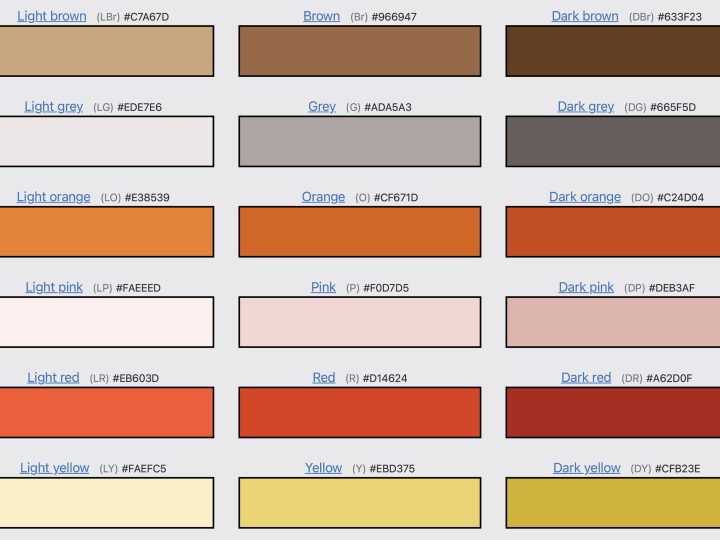
The DttG color system, designed by Hall-Aquitania, was developed to address the issue of different researchers using completely different color descriptions for ground layers with similar compositions.23 The color system was devised following Brent Berlin and Paul Kay’s 1969 theory of basic color terms, which stipulates that color cognition is an innate physiological process rather than a cultural one. According to Berlin and Kay, there are eleven basic color categories in English: white, black, red, green, yellow, blue, brown, purple, pink, orange, and gray.24 For the specific case of grounds, three categories—green, blue, and purple—can be excluded, as these colors do not correspond to existing historic preparatory layers. The system extends Berlin and Kay’s framework by subdividing the remaining eight categories into three tints and shades each, using the modifiers “light” and “dark” to capture greater nuance.
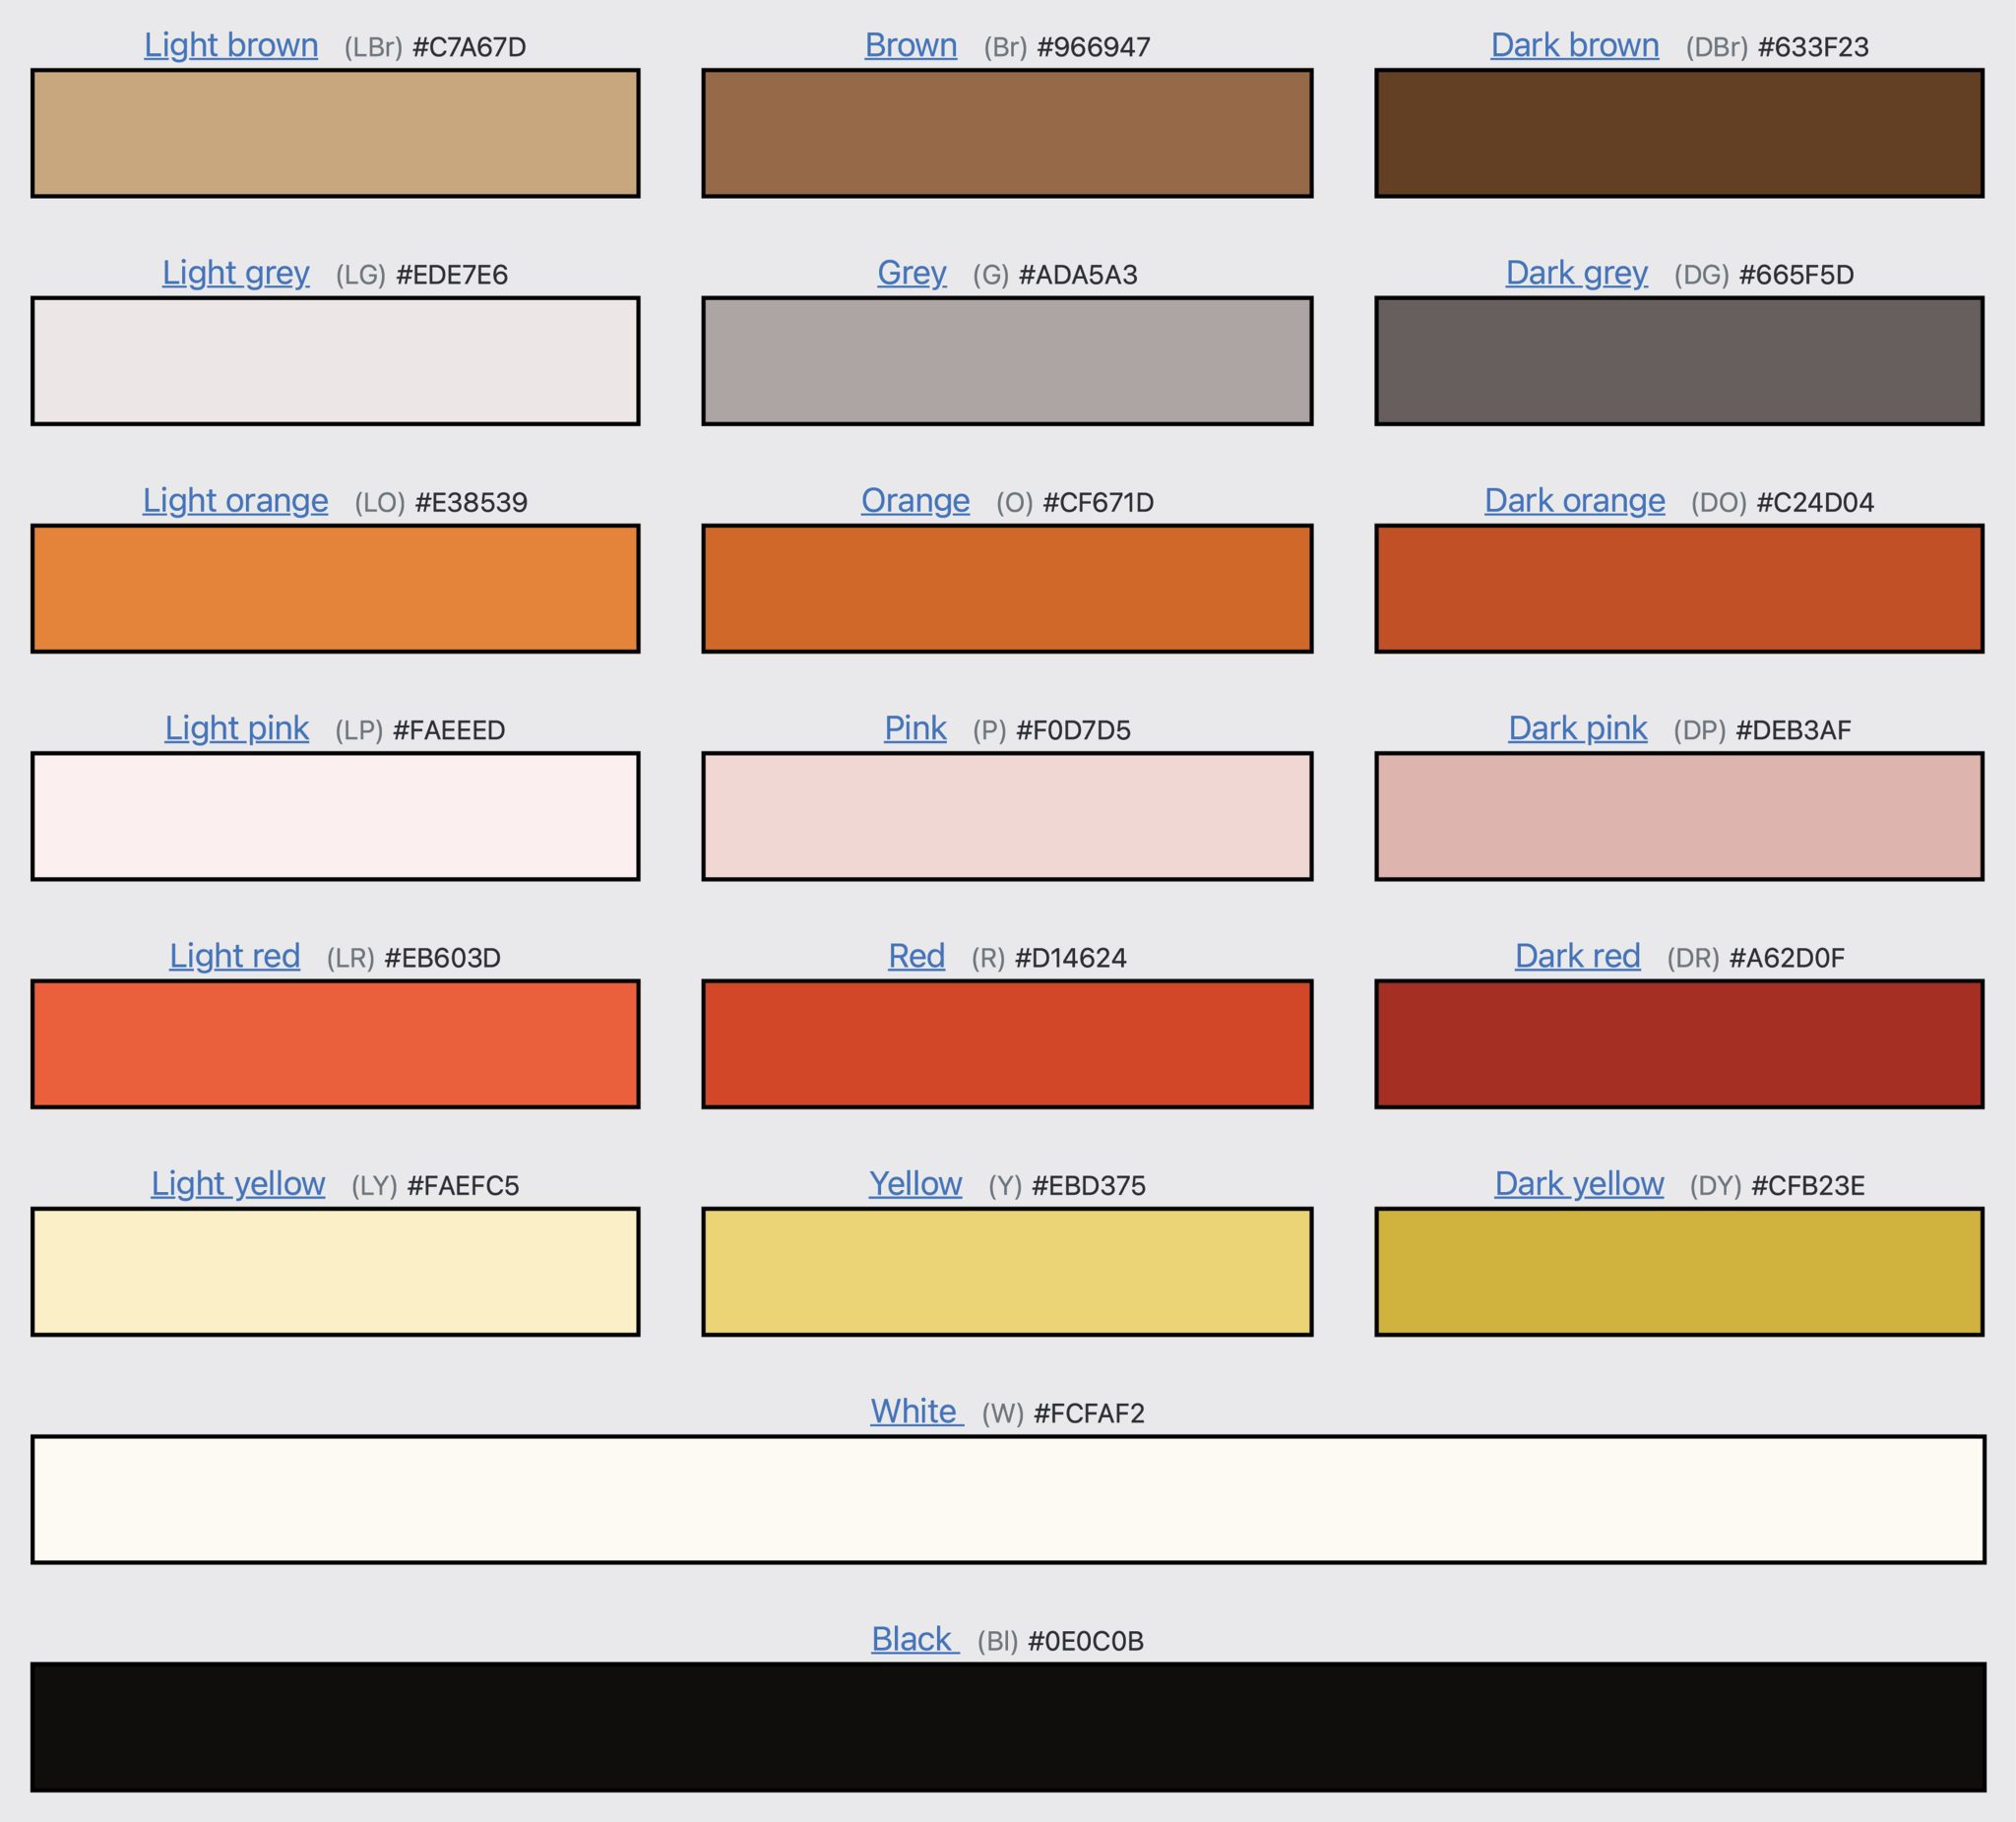
A color-checker based on these terms was then crowdsourced from technical art historians and conservators, who were asked to provide specific color samples for the terms gleaned from Berlin and Kay based on their professional experience observing sixteenth- and seventeenth-century colored grounds. The collected responses were used to create a color-checker with HEX color codes, which is provided alongside the database and used in visualizations of the layer structures (fig. 5). This color system allows for the grouping of ground layers that are similar in color but may have been described by different researchers with widely varying terms—such as “fawn,” “light beige,” “sand,” or “pale yellowish brown,” which in the DttG database are grouped under the unified term “light brown.” Importantly, the original free-text descriptions are retained in the database alongside the standardized categories, ensuring that the specificity of the original observation is retained.
Constraints of Data Collection in Excel Sheets
While the wealth of data collected in the initial stage held great potential, it was evident that this potential could not be fully unlocked in its original format: a static, single-sheet Excel spreadsheet. Although it functioned adequately as a data repository, the Excel sheet was so large that it was cumbersome to navigate and lacked the dynamic functionality necessary for in-depth exploration of the data. To overcome these limitations, we developed an intuitive interface, layered over the existing Excel datasheet. The use of this tool requires no programming skills, making it accessible to all researchers. It is designed to streamline the process of adding and interacting with data, enhancing both its accessibility and functionality.
Beyond Excel: Creating a Tailored Database Tool
Restructured Data Architecture
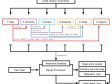
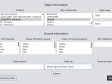
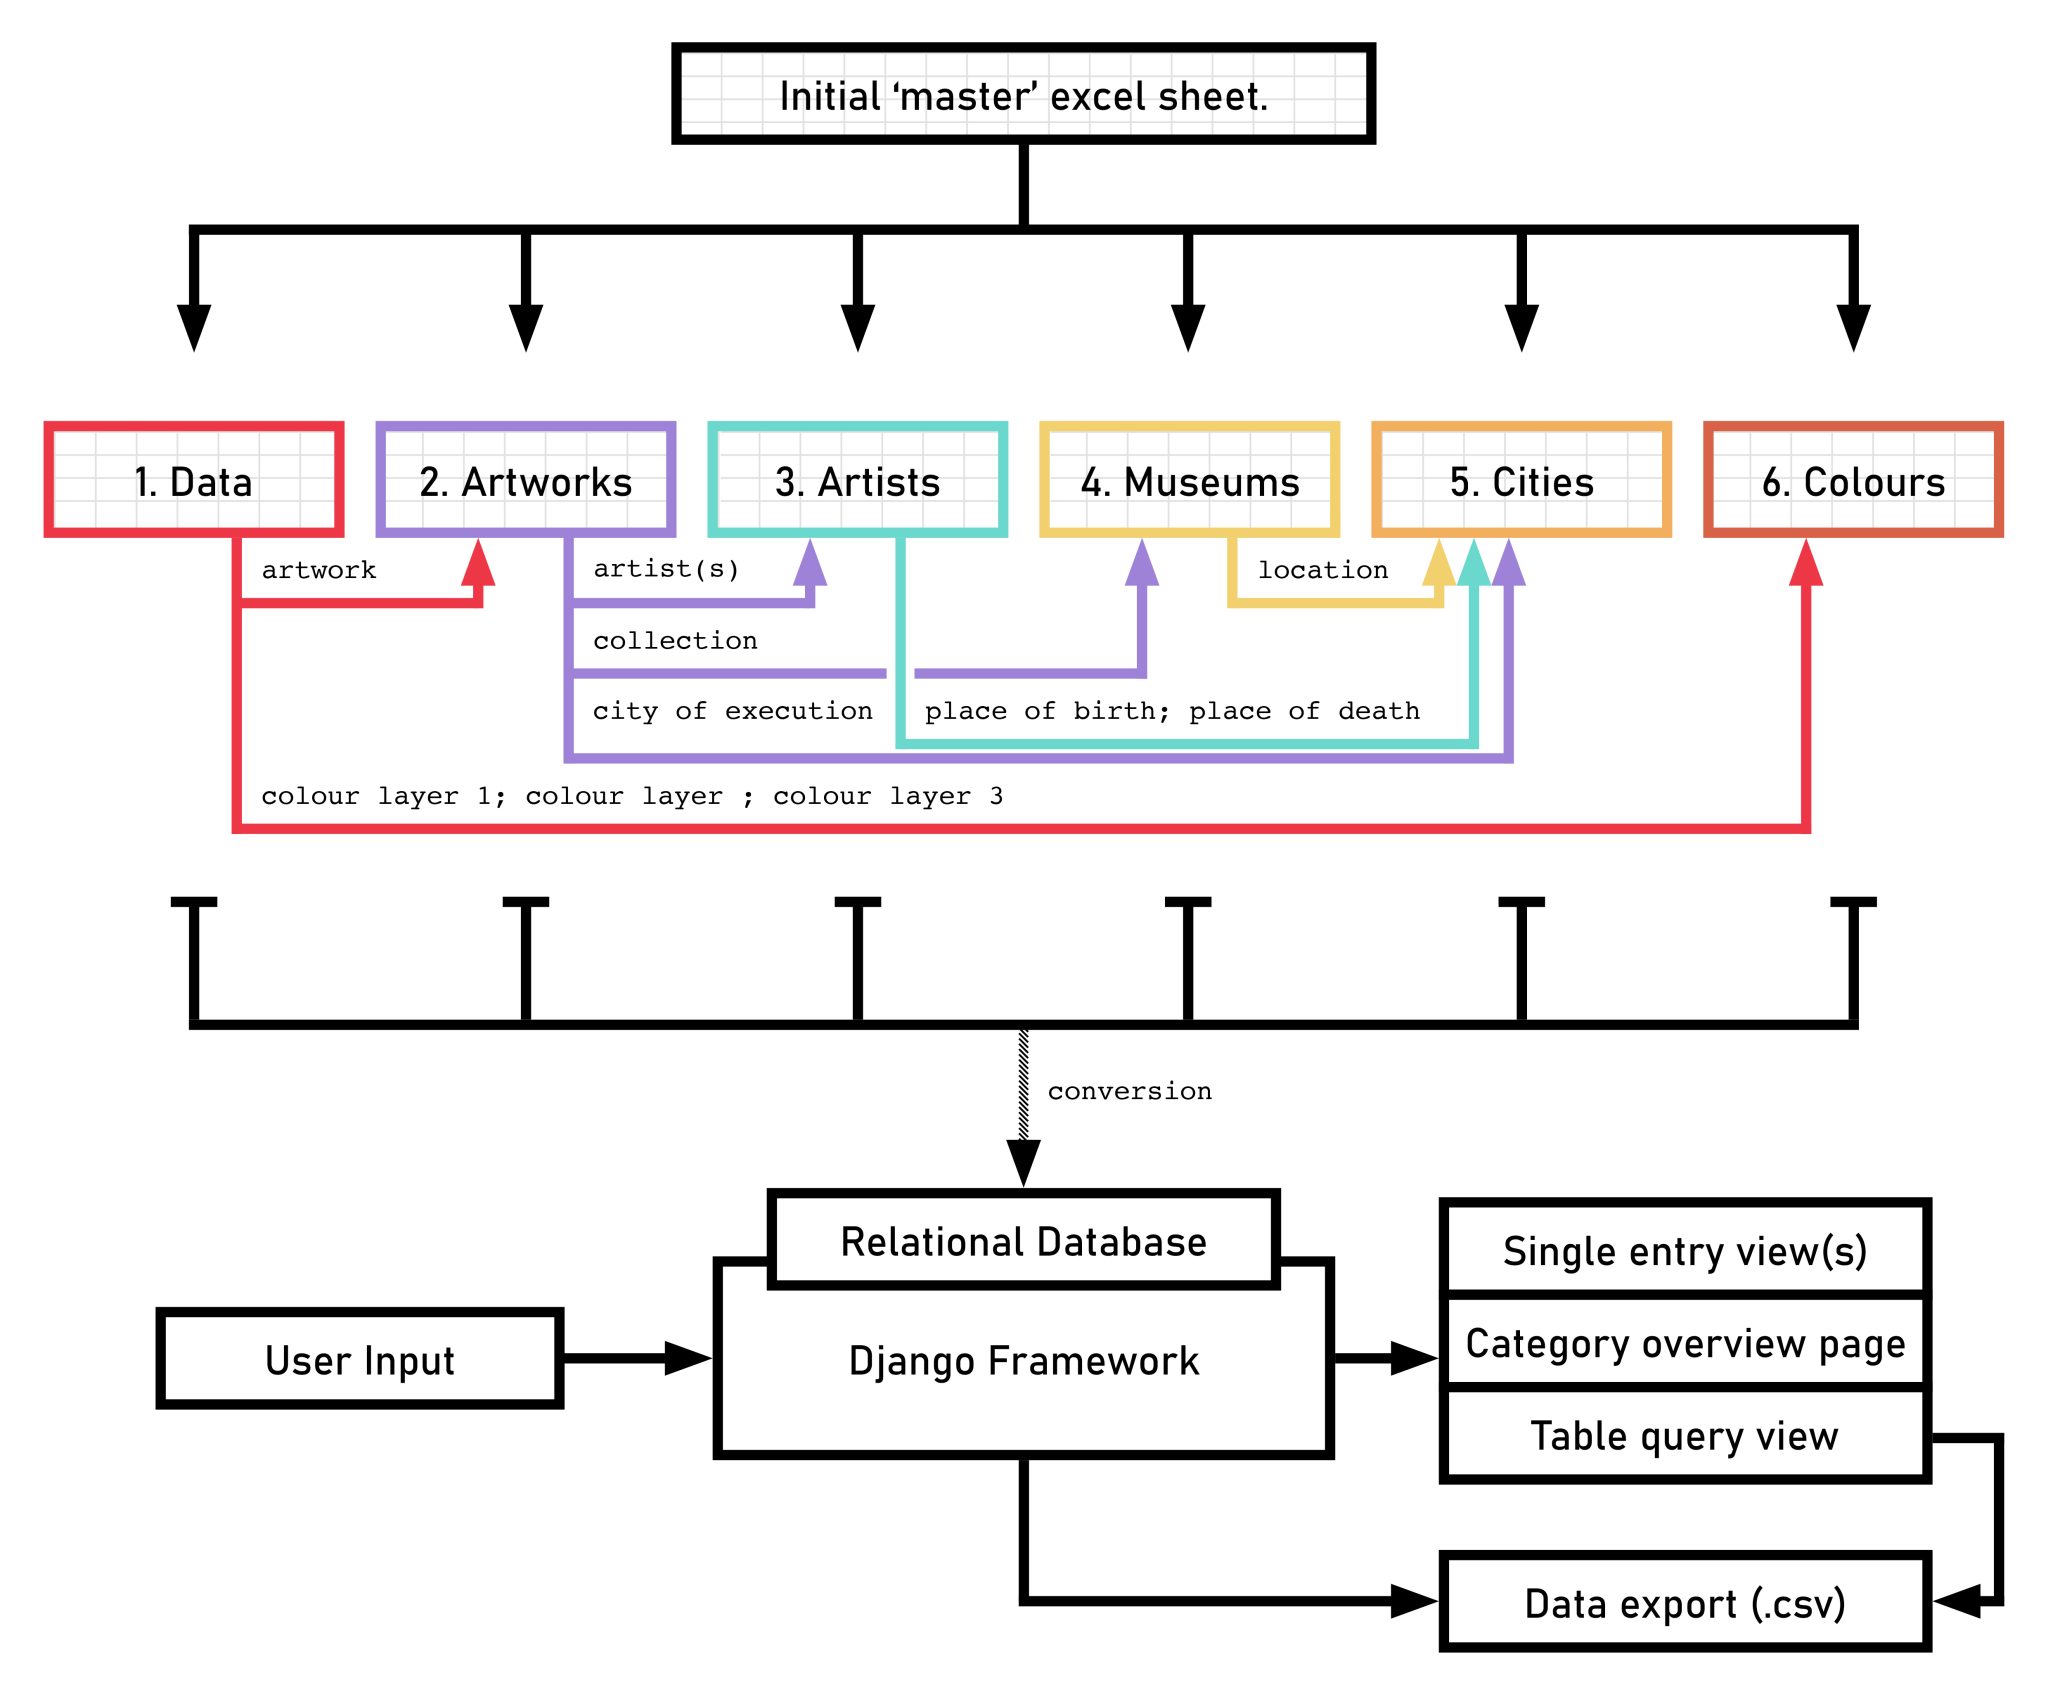
The first step in developing the DttG database tool involved a shift from the horizontal data structure typical of spreadsheets to a relational database model. Unlike a single-table spreadsheet, which can become unwieldy and repetitive, a relational database organizes information across multiple interconnected tables. For instance, in the original “master” sheet, each individual entry for a painting by Abraham Bloemaert required repeatedly entering details about the artist, such as his birth and death dates, as well as additional metadata, such as the location of the artwork. By contrast, the relational model streamlines this process: Bloemaert’s biographical details are stored once in a dedicated “Artists” table and linked to multiple paintings, eliminating redundancy and enhancing clarity (see fig. 6 for the database structure). Each artist, artwork, and museum is assigned a unique identifier that can be referenced in any of the tables, linking the data together in a structured and scalable way. This change not only saves time and reduces the chance for errors in data entry but also ensures a more organized and legible data structure.
Interactive Database Tool
After converting the underlying data structure, Van Laar created a custom tool that allows researchers to interact with this data in a user-friendly manner. The tool was built using Django, a well-established, free, open-source web framework based on the Python programming language, designed specifically to simplify the creation of complex, database-driven websites. Django has been a reliable choice since its inception in 2005 and is supported by comprehensive documentation and regular updates that ensure the long-term viability of the DttG database tool.
In basic terms, Django serves as a bridge between the database and the user, allowing data to be presented in an accessible and interactive format. To make this possible, a developer creates webpage templates using HTML (HyperText Markup Language), the standard language used to structure and display content on the web—essentially determining how text, images, and data appear on screen. These templates define how the data will be arranged visually once retrieved.
Behind the scenes, the interaction process with the DttG database is threefold:
- User Request: The user requests specific information (e.g. a certain painting or a specific query) through the database’s web interface.
- Processing Data: Django retrieves the relevant data from the database and integrates it into predesigned HTML templates, dynamically generating a webpage that presents the data.
- Response: The generated webpage is then delivered to the user, who can explore and interact with the data.
Because these HTML templates form the basis of how the data is ultimately presented, it is important for the researchers and the developer to work together on their design. This ensures that the interface not only displays the data clearly and effectively but also accommodates the specific needs and research questions of its intended users. In the case of the DttG database, the fact that Van Laar, who developed the code, was primarily trained as a technical art historian added a unique dimension to this project, allowing for a more nuanced integration of domain-specific knowledge into the tool’s design.25
Functionality in the DttG Database Tool
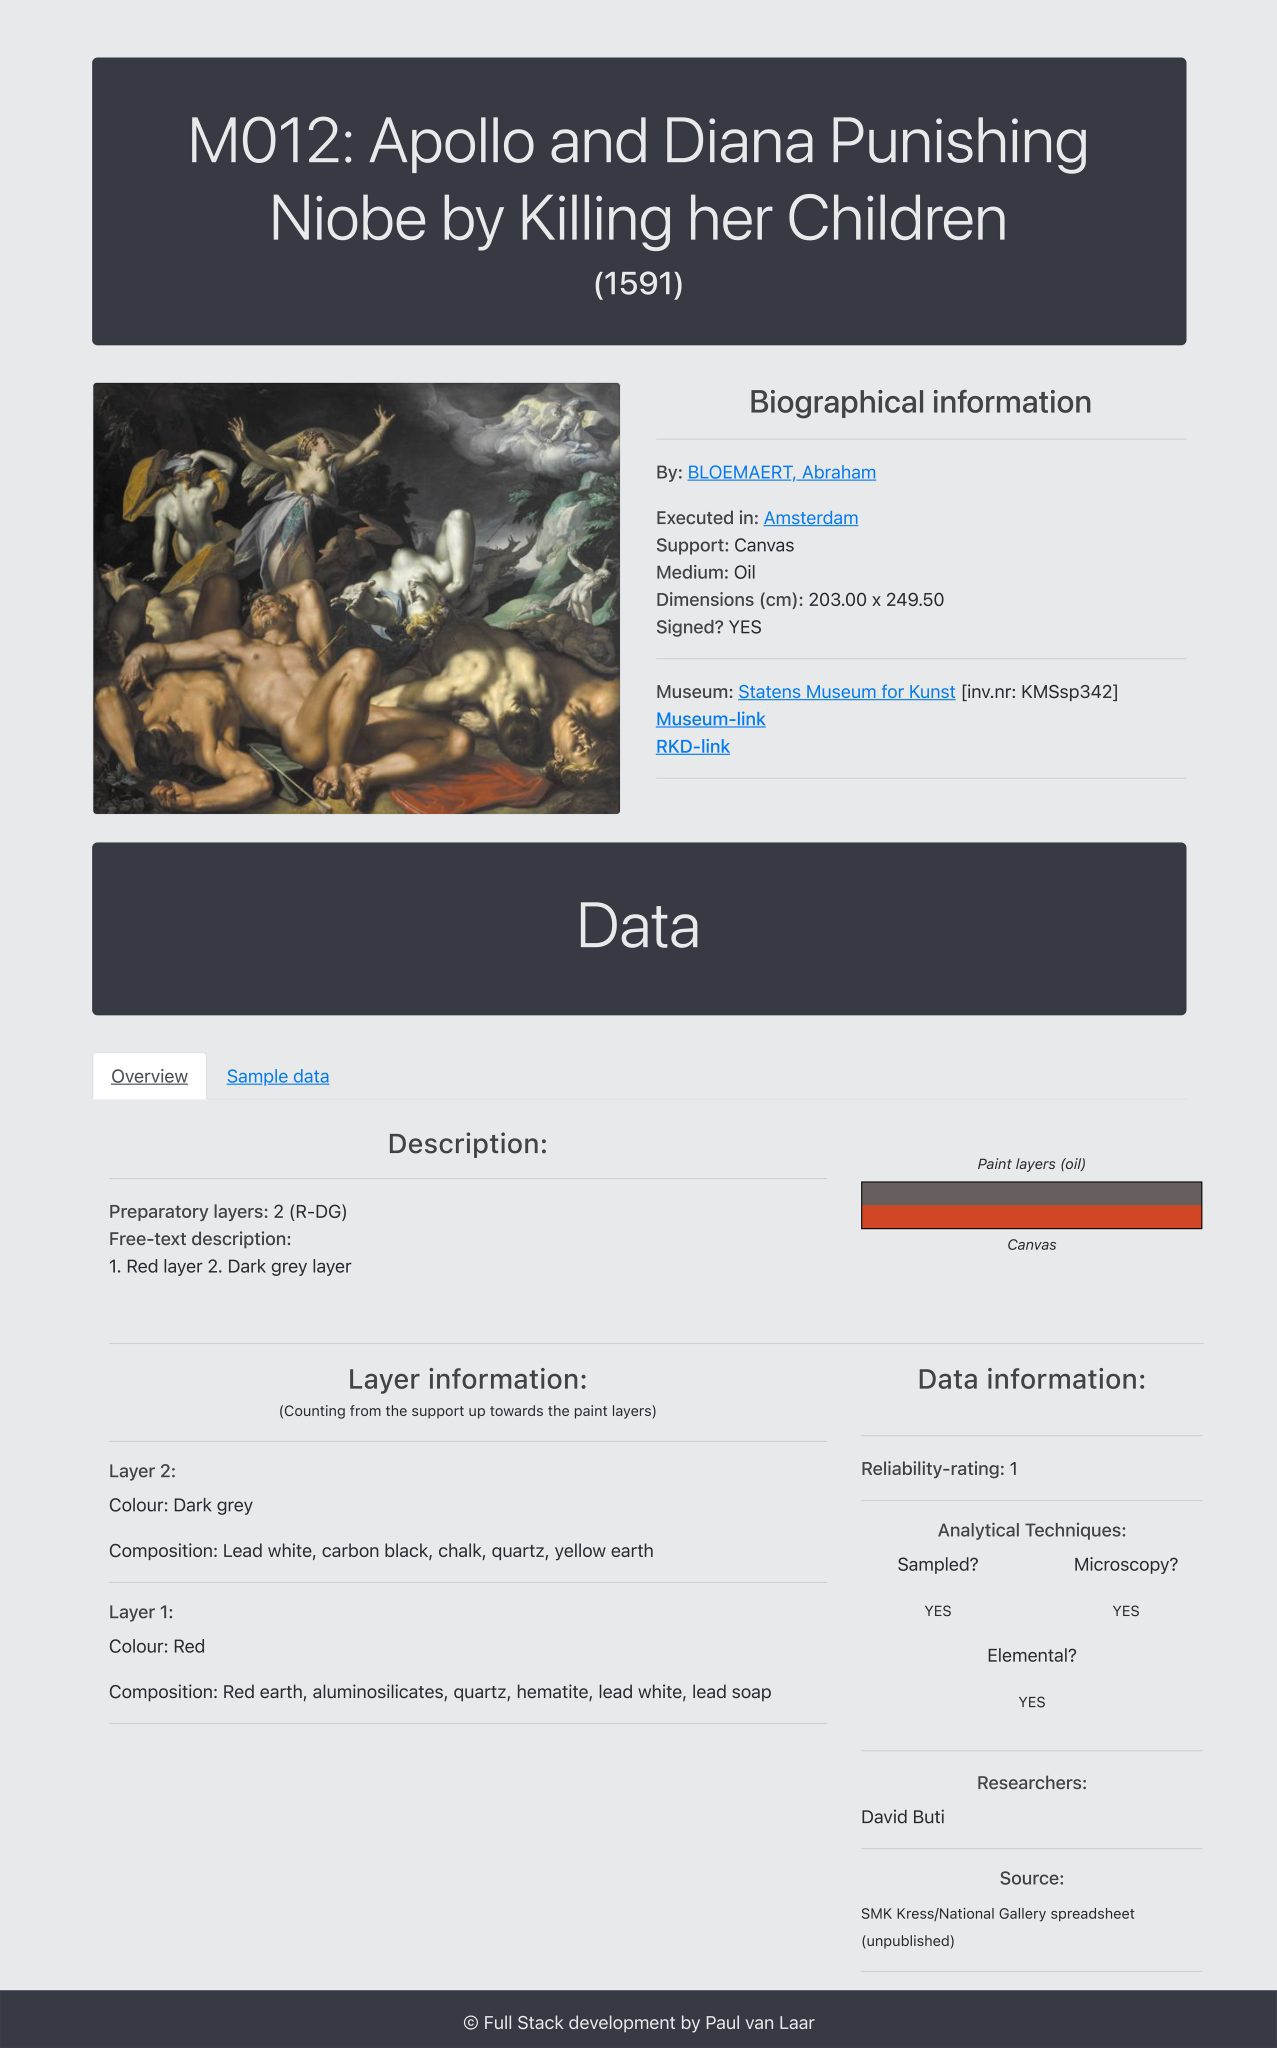
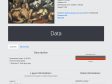
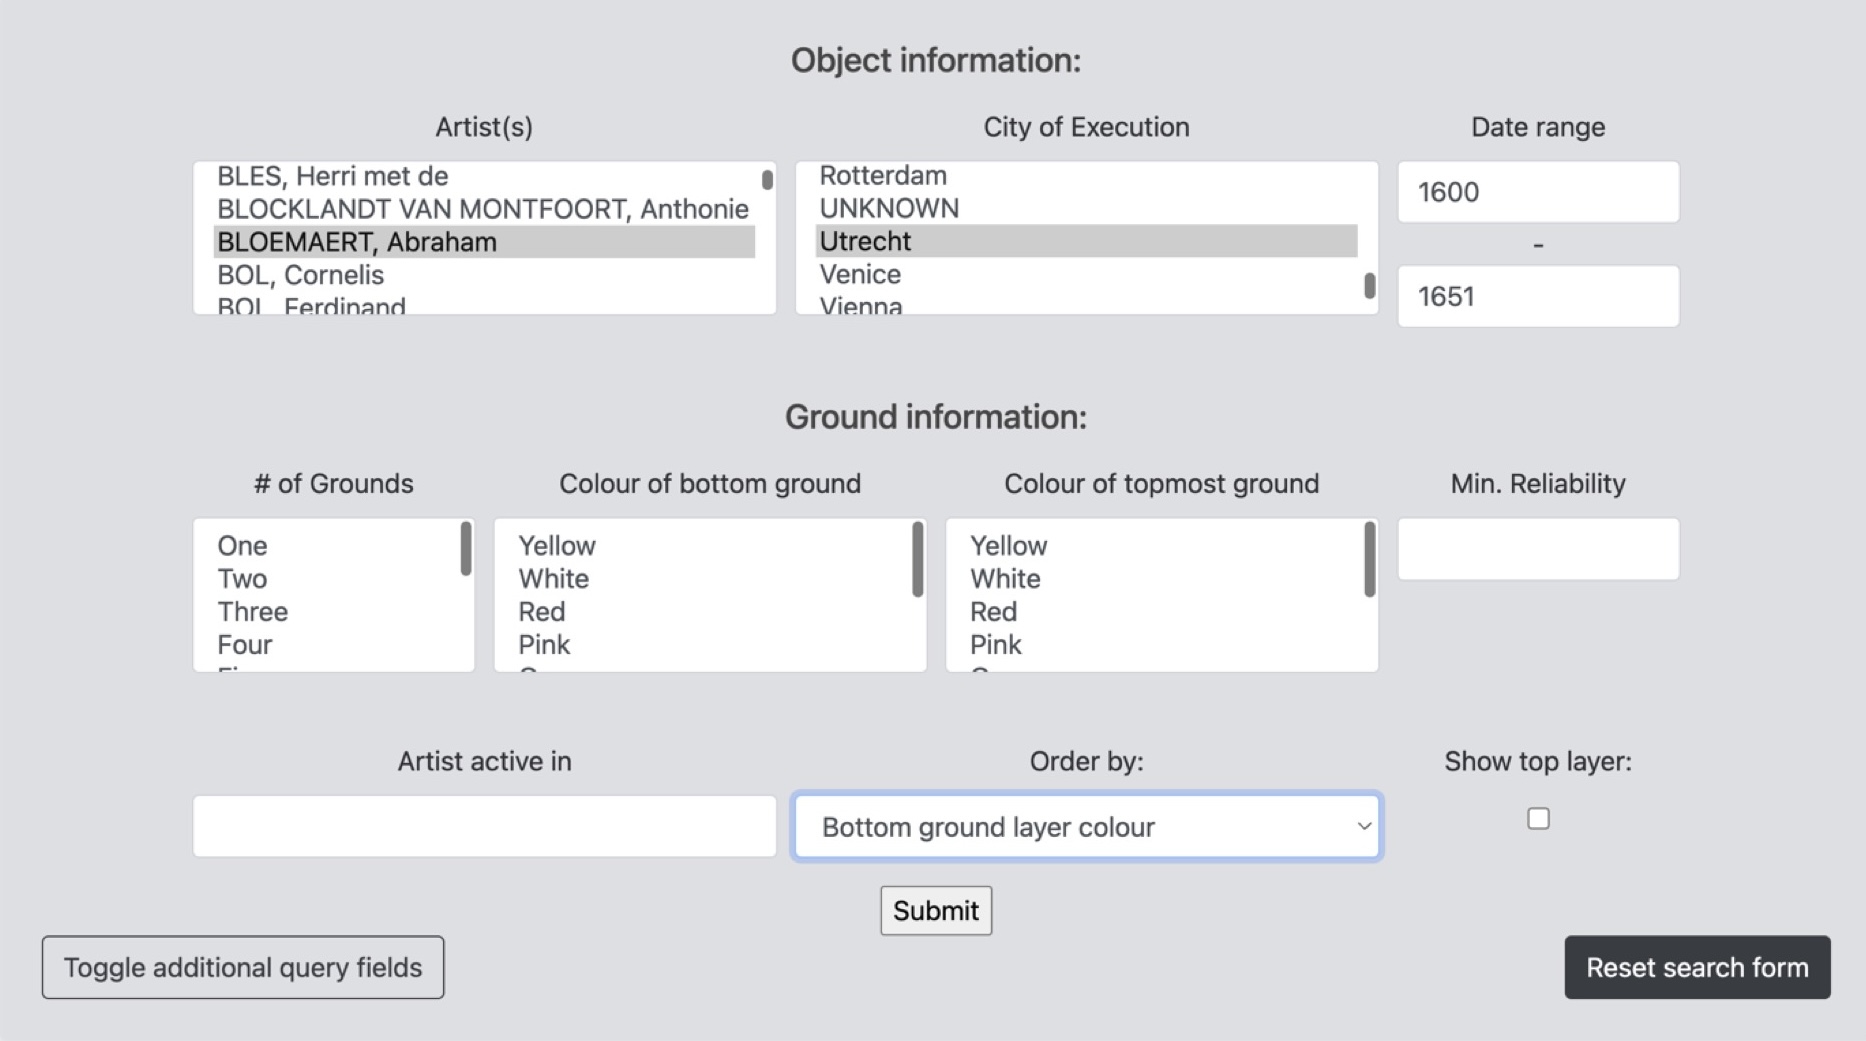
The tool presents the database as an interactive website, where all the data entries can be explored through dedicated dynamic pages that organize biographical and technical data in a clear and accessible manner (fig. 7).26 Its enhanced functionality for interaction and data manipulation sets it apart from traditional static data repositories, such as Excel spreadsheets. Using either a simple or advanced query interface, researchers can search the database according to any combination of fields, such as artist, location, support, and/ or ground layer color. For instance, one might retrieve all of Bloemaert’s paintings made in Utrecht after 1600, sorted by the color of the bottom ground layer (see fig. 8). All fields and metadata present in the database—including the reliability rating as well as the support, or a specific city the artist was active in (based on RKDartists data)—can be used to fine-tune the queries.
The query functions are particularly significant as the tool has now moved beyond merely storing and displaying data to actively supporting research. Query results are shown as a browsable list of entries, each formatted like those in figure 7. In addition to exploring results within the tool itself, users can also export their query results as data in a CSV (comma-separated values) file format. This functionality enables users to work with precisely defined subsets of data, tailored to their research questions, outside the database environment, using any preferred tool or method. This is a vital feature in the context of open-source and accessible data use, ensuring that the DttG database remains a valuable resource for future research inquiries without being limited by the design or scope of the present interface.
This export functionality also facilitates more advanced data analysis on the user’s side, such as network analysis, which may reveal connections and trends not immediately apparent through the DttG database’s web interface alone. A recent publication by Lauryn Smith illustrates how the release of the Montias Research Database as downloadable CSV files in 2019 uncovered much information still hidden in the data, previously hard to explore due to the limited interface that exists on top.27 For their contribution to this issue, Stols-Witlox and D’Hont formulated a DttG query that identified all paintings on canvas with two or three ground layers, where the second ground layer probably contains lead white. This produced a CSV file of 281 grounds that the authors were able to reformat to incorporate into their own dataset.28
It is important to stress that the DttG database was designed primarily as a framework and data overview tool; its purpose is to bring together highly fragmented technical information and make it explorable at scale.29 More interpretive or domain-specific applications—such as tracing workshop connections, analyzing the use and spread of specific pigments, or exploring economic dimensions of material use—require different methodologies and disciplinary perspectives. By making the full dataset open access and its underlying code open source, the project actively invites others to build on this foundation, applying their own tools and research questions.
Some of that future potential is already structurally embedded. While images of paintings and cross-sections are not yet included due to copyright and time restrictions, the HTML templates and database structure are fully equipped to support them. Likewise, geographic coordinates are stored in the “Cities” table, which could allow for the integration of interactive maps showing the current locations of artworks or their place of execution. Other expansions—such as filtering by pigment or elemental data, integrating cost data, or visualizing artist networks—have not yet been implemented but remain possible. While these features lie beyond the immediate scope of the DttG project, the open-source nature of the database means they could be developed and added by others in the future.
Method for Data Input
To ensure that the database remains in use and expandable, the method for data input was designed around the six relational Excel sheets (see appendix A), which can be imported into the Django database using custom-built Python scripts. This approach was chosen for two key reasons.30 First, it ensures maximum accessibility, as most researchers—particularly in the humanities—are more accustomed to working with Excel spreadsheets than custom databases. By utilizing a familiar format, we lower the barrier to participation and make the process of contributing data more intuitive. Second, using Excel as an intermediary allows for a vetting process. External users can submit their data in spreadsheet form, where it can be reviewed by an administrator for consistency, accuracy, and quality before being integrated into the larger database. This collaborative potential ensures that the database remains an evolving resource, which will only fuel more comprehensive understanding on the presence and spread of colored grounds as it grows.
Framing the Database in a Wider Context of Digital Art History
Much has changed since 2013, when Johanna Drucker’s critical paper “Is There a ‘Digital’ Art History?” observed that, despite some promising advancements, digital technologies had not yet fully integrated into the core methodologies of art historical inquiry. For digital methods to truly transform the field, Drucker argued, we would “have to see a convincing demonstration that digital methods change the way we understand objects.”31 While a complete historiography of digital art history is beyond the scope of this article, the landscape has evolved significantly since Drucker’s publication. Digital tools and techniques are becoming increasingly common components of the art historian’s toolkit. While some limitations in adopting digital methodologies have been attributed to the underdevelopment of image analysis tools, compared to tools for textual analysis, this has largely been overcome in recent years due to significant advancements in computer vision and machine learning.32 Special issues on digital art history in Visual Resources (2014 and 2019) and a 2021 review further highlight the growing acceptance and use of digital methodologies in art history.33
Databases in Art History
An important subset of digital art historical knowledge building is the use of databases that contain information that can be subjected to advanced data analysis techniques, such as network analysis.34 Reflecting the diverse nature of art historical knowledge, these repositories vary in content. The early focus was on creating online image repositories, facilitating the study of works of art in numbers previously impossible.35 More recent online databases, like RKDartists and ECARTICO, provide biographical data, while others, such as Project Cornelia, the ARTECHNE Database, the Digitale Kunst-Pforte, and the Montias Database of 17th Century Dutch Art Inventories, focus on presenting transcribed archival information.36 Even more recently, the Dutch Textile Trade Project developed a standalone digital database that allows for the dynamic exploration of textile-trade data drawn from trade records, samples of textiles, and historic depictions of textiles in use.37
There is, however, a notable gap in the availability of comprehensive databases focusing on technical data related to artworks. This gap likely arises from several factors: institutional copyright issues and a lack of clear agreement about permissions related to analytical data of artworks, the difficulty of consistently categorizing free-text information in conservation reports and scientific publications, and a general need for established methods for storing such data in accessible, user-friendly formats. The availability of such data is crucial for rigorous art historical research and the ability to make bold, large-scale statements about artistic developments, schools, and training, which can be overlooked when conducting focused case studies. To turn back to Drucker’s statement, access to technical data should be widened precisely to demonstrate a change in the way artworks are perceived on a grand scale.
At present, there are few examples of publicly accessible technical data repositories. While museums might have systems in place to host their cross-section images or other technical data internally, there is a reluctance to make this available to researchers outside the institutional confines. Currently there are only few examples. The Rembrandt Database, hosted by RKD, is “an inter-institutional research resource for information and documentation on paintings by Rembrandt—or attributed to him, either now or in the past—in museums around the world.”38 It contains various types of technical data, such as treatment reports, cross-section images, SEM-EDX data, raking-light and UV photography, and dendrochronology results. RKDtechnical, the RKD’s database of technical documentation on Netherlandish painting, serves as a digital hub that brings technical research into dialogue with art history.39 Lastly, the National Gallery of Denmark (Statens Museum for Kunst) has a publicly accessible database with information on the preparatory layers of 158 cross-sections.40
Key Themes for the Future of Digital Art History
The development of the DttG database for colored grounds serves as a proof of concept that demonstrates the substantial art historical value of compiling and presenting large, comprehensive technical datasets on artworks. One of the major challenges in the technical study of artworks is the fragmentation of data across singular publications, institutional repositories, and individual researchers’ spreadsheets. Improving access to technical data should be a primary focus of large institutions, preferably through fully publicly accessible repositories. To allow for data to be effectively sorted and grouped, irrespective of its source, there must be standardized methods for data formatting, normalization, and reliability assessment. This approach also facilitates the integration of old and new data, bridging the gap between the data output from high-level research projects and the routine analyses conducted in museum laboratories.
The development of custom categorization systems within the DttG database is part of a broader movement toward adopting and developing normalized vocabularies and formats. The color system was developed specifically for the DttG project, as no suitable controlled vocabulary for describing historical ground layer colors existed at the time. Similarly, the reliability rating system was created to be able to handle data of highly variable quality and specificity, while retaining full transparency about the origins of observations drawn from it. For other fields in the database—such as artist names and locations—existing controlled vocabularies were consulted where relevant, with RKDartists used as the standard reference for normalization. This is essential to ensure that future researchers can accurately understand the data, minimizing the risk of misinterpretation.
Examples of other efforts for standardization include longstanding systems now adapted for digital applications, such as the ICONCLASS system, which dates back to the mid-20th century, and more recent initiatives like the Getty Vocabularies.41 Additionally, the CIDOC Conceptual Reference Model (CIDOC-CRM), initiated by the International Council of Museums (ICOM), is leading the way for the creation of a formal ontology to support the coherent documentation and interpretation of diverse cultural heritage data, enabling integration and exchange across various domains. While the DttG database does not currently include iconographical or typological data (and therefore does not rely on these systems), we recognize the importance of such frameworks for other domains. Tools like the Getty Vocabularies or CIDOC-CRM offer valuable models for interoperability and linked open data and could become increasingly relevant should the scope of the database expand in the future—for instance, to include treatment data, pigment use, or iconographic categories.
In specialized cases where no preexisting standardized systems are available, researchers and projects may need to develop their own frameworks. For instance, the Victoria & Albert Museum’s Chinese Iconography Thesaurus provides a controlled vocabulary to standardize terms that were previously subject to confusion and inconsistency. Beyond standardizing terminology, transparent documentation of analytical protocols and normalization of analytical procedures greatly enhances the comparability of similar types of data between institutions. In the context of the IPERION-CH project, the National Gallery and its partner institutions reviewed basic imaging procedures of polished cross-sections, and through relatively simple adjustments to the imaging protocol, they were able to achieve significantly more consistent results across different institutions.42
Conclusion
The landscape of available art historical data has undergone significant changes in recent decades. With the continuous development and implementation of advanced analytical techniques, the amount of knowledge that can be drawn from a single work of art has grown to unprecedented levels. However, with such large technological leaps there is a marked disparity between the capacities of typical day-to-day research projects and documentation at smaller institutions, and those of “blockbuster” projects at some of the world’s leading universities and cultural heritage institutions.43
Importantly, the value of research does not lie in the level of the analysis alone: not all research questions require the most sophisticated techniques. The sustainability of technical art historical research depends not on uniformity of method but on fostering a productive dialogue between tiers of inquiry—from advanced, large-scale analyses to smaller studies, and everything in between. While the pioneering methods of ambitious studies are essential for advancing analytical capabilities and expanding the horizons of our lines of inquiry, they cannot stand alone. Without the broader context provided by smaller, less resource-intensive projects, the insights drawn from in-depth analyses of individual works or artists may lack the necessary framing. Rich insights can emerge from both approaches, but it is through their integration, and the ability to examine different types of technical data side by side, that we can move beyond isolated case studies and toward more comprehensive technical art historical inquiry.
The DttG database of colored grounds addresses this divide by combining newly conducted research with older, preexisting data to offer a more comprehensive overview of the use and spread of colored grounds in Netherlandish painting. By making both the database and its source code publicly available, we hope that the tools developed for this project can be applied by any researcher interested in exploring or building on the data. Beyond its immediate value as a resource for research on preparatory layers, the DttG database also demonstrates the broader potential of rethinking how we handle and use technical data. With relatively modest interventions and resources, a static spreadsheet was transformed into a dynamic, open-access research tool that actively supports technical art historical research. The tool’s development in Django, built on the Python programming language, also highlights the accessibility of such methods. Python is widely used in digital humanities, supported by extensive open documentation, and valued for its clear syntax and readability, which make it relatively easy to learn even for researchers without formal programming training. Approaches like this should be encouraged as standard practice across researchers and institutions, particularly when so much valuable data remains inaccessible in individual researcher’s spreadsheets. As access to research data continues to expand, this project underscores that, provided we pay careful attention to data curation, normalization, and infrastructure from the outset, ambitious, wide-reaching technical art historical research can be conducted using data that is already available.